With our fifth year of the open course in the books, I wanted to take this opportunity to share some of the outcomes and results of the course. While these are summary data, you can see the full reports/analyses on our open course data page. I’ll also speak to some of the exciting changes we have planned for the 2022 course, our sixth run of this free professional development experience. Be sure to read to the end to learn the latest info for our next course offering!
Results from 2021 (Course 5.0)
This year, we saw 1669 participants enroll in the course, with 250 of them successfully completing the course. This 15% completion rate is lower than our past few years, which could be attributed to a host of factors associated with COVID, as well as the fact that we added two assignments to the course – requiring more of participants to earn the course badge for successful course completion.
Who took the course?
With respect to who took the course, the profile of our participants is largely the same as it has been before. The following information is gathered from students completing the Welcome Survey and consenting to their data being used for course improvement, research, and publication purposes (N = 821).
 71% of participants identify their sex as female and 71% identify their gender as woman.
 65% of participants were 25-44 years old.
 Participants typically have advanced degrees (59% Masters, 20% Doctoral).
 Participants self-reported beginner (45%) or intermediate (48%) assessment competency
 70% of people report less than half of their job is dedicated to assessment.
 Learning styles are both passive and active – both a good fit for a self-paced course.
 87% anticipated* spending less than 4hrs on the course per week – 60% said 1-2 hrs.
- *91% of completers spent less than 4hrs (71% said 1-2hrs).
 People are most likely to hear about the course from a friend or colleague.
 People are most likely to take the course because they enjoy learning or to gain skills for work.
 Participants came from various institutions, with the top three concentrations from:
- Public 4-year schools over 10,000 students (38%)
- Private 4-year schools under 10,000 students (19%)
- Community Colleges under 10,000 students (11%).
Participant Feedback about Course
End of course evaluation occurs by way of a user experience survey offered to all students. There was an initial sample of 261 respondents, which was filtered for students who gave consent for us to use their data and then – for consistency in reporting populations – filtered for course completers (N=226).
- 95% of course completers agreed or strongly agreed course materials (videos, lectures, readings) had a positive impact
- 86% of course completers agreed or strongly agreed course activities (quizzes, assignments, discussion boards) had a positive impact
- 77% of course completers responded with an 8 or higher on a 10-pt scale on likelihood to recommend the course
- 93% of course completers gave the overall course rating a 4 or 5 out of 5 stars
Participant Learning
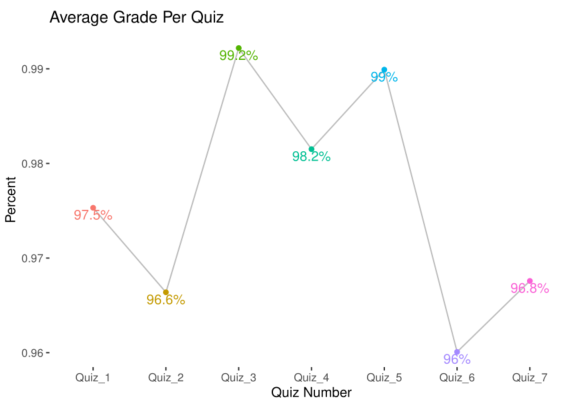
Student learning was analyzed in seven quizzes and two assignments. Despite the threshold for success being 75% per quiz, students typically do far better, with no averages across quizzes being below 96%.
Overall, students who completed the course did pretty well on assignments. While there was not a threshold for success other than turning the assignments in, the mode scores for Module 3 were 28/30 (93%) and the mode scores for Module 5 were 23/25 (92%).
Data Disaggregation
While there are many variables and ways to disaggregate the data, we decided to disaggregate results by percent of job dedicated to assessment and institutional type of participants. While we also have competency levels with assessment, those are self-reported and understanding of competency levels varying by individual. We may disaggregate by other demographics in the future, but these results afforded plenty for us to reflect upon as we consider who is taking the course.
Disaggregating for percent of job dedicated to assessment:
- Quiz Results: Highest scores came from the folks who had 0-20% of their job dedicated to assessment. The most scores below 90% per quiz were reported by the 61-80% and 41-60% folks (7% and 6% of their populations, respectively). Similar trends held for the individual quiz results (Quiz 1, Quiz 3, Quiz 4), though the 41-60% folks had the highest scores on Quiz 6.
- Assignments:
- Most perfect scores for Module 3 came from the folks who had 61-80% of their job dedicated to assessment (36% of scores), while the population with combined mode score of 28 and perfect scores of 30 were the folks with 41-60% of their job dedicated to assessment (66% of scores). The lowest scoring population for Module 3 results were the folks with 21-40% of their job dedicated to assessment (50% of scores were 28 and 30).
- Module 5 results saw the 81-100% folks with the most perfect scores (37% of scores), while the population with the most combined mode score of 23 and perfect scores of 25 were the folks with 61-80% of their job dedicated to assessment (100% of scores). The lowest scoring population for Module 5 results were the folks with 81-100% of their job dedicated to assessment.
- Student Feedback: The 0-20% folks appreciated course materials and activities the most and spent the least amount of time on the course. The 41-60% were most likely to recommend the course, while the 61-80% folks gave the course the highest overall course ratings. The 81-100% folks spent the most time on the course each week, but seemed the least satisfied with the course overall.
Disaggregating for institutional type:
- Quiz Results: Highest scores came from the folks at Community Colleges over 10,000. The most scores below 90% were reported by Other and Public 4-year under 10,000 (9% and 8% of their populations, respectively). While trends were a bit less predictable with highest and lowest scores by institutional type, Community Colleges over 10,00 did have the highest scores for multiple individual quizzes(Quiz 2, Quiz 6, Quiz 7), while the Other folks had the highest scores on Quizzes 1 and 3.
- Assignments:
- Most perfect scores for Module 3 came from the folks who had the Community Colleges under 10,000 group (33% of scores), as well as the population with combined mode score of 28 and perfect scores of 30 (72% of scores). The lowest scoring population for Module 3 results were the Other folks (43% of scores were 28 and 30). Interesting that the Community College over 10,000 students scores were the highest percentage overall and the Community College under 10,000 students were second-lowest.
- Module 5 results saw the Public 4-year over 10,000 folks with most perfect scores (35% of scores), while the population with the most combined mode score of 23 and perfect scores of 25 were the Community Colleges over 10,000 and Other folks (tied at 91% of scores). The lowest scoring population for Module 5 results were the Public 4-year under 10,000 folks (74% of scores). It is interesting that the Other group was tied for best scores on this assignment when they had the lowest scores for Module 3.
- Student Feedback: Public 4-year under 10,000 appreciated materials, activities, and were most likely to recommend the course; Private 4-year under 10,000 least appreciated materials, activities, and were least likely to recommend the course. Community College under 10,000 folks spent the most time in the course and had some of the highest course ratings (4 or 5 out of 5 stars). The Other folks were least likely to recommend the course and offered the lowest course ratings.
What’s New in 2022 (Course 6.0)?
There are several new developments for the upcoming course. First, I’m excited to share we have two new instructors. A heartfelt and deep amount of gratitude goes out to Dr. Ben Andrews and Dr. Emily Langdon for their years of service teaching the course. We look forward to the new perspectives and contributions coming from Dr. Megan Bell and Dr. Greg King! You can learn more about each of them on our faculty contributor page.
We are also excited to have a new sponsoring partner in AEFIS and leveraging resources of their AEFIS Academy. Through this partnership, the course is able to intentionally integrate, benefit from, and share with participants a number of rich resources (webinars, blogs, groups, networking, and more!) via a centralized and accessible resource where people can engage and learn beyond and in addition to our course. You don’t have to wait for the next course run to begin taking advantage of this partnership, however, as AEFIS Academy is free for anyone to join – go ahead and sign up and explore!
As alluded, we have more detailed reporting with respect to course data and student feedback. We continue to review those materials and discuss ways in which to enhance the course to provide for a more engaging, meaningful, educational, and helpful experience for future participants. End-of-course qualitative analysis was especially rich with information to help focus our course enhancements.
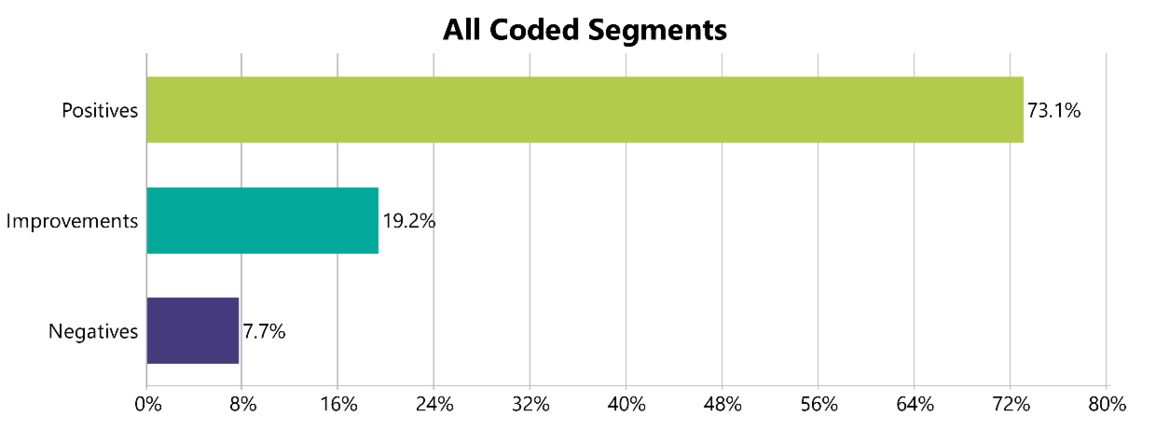
Analyzing the feedback about the course experience, participants had mostly positive things to say. When breaking down what the positive comments related to, it is clear the majority of folks appreciate the course for what it is, its resources, and a positive experience. The majority of negative feedback is associated with specific components of the course. More insight can be gained in looking at the feedback coded for improvements (which can include positively-charged comments), as it gives more detail of aspects of the program which could be improved.
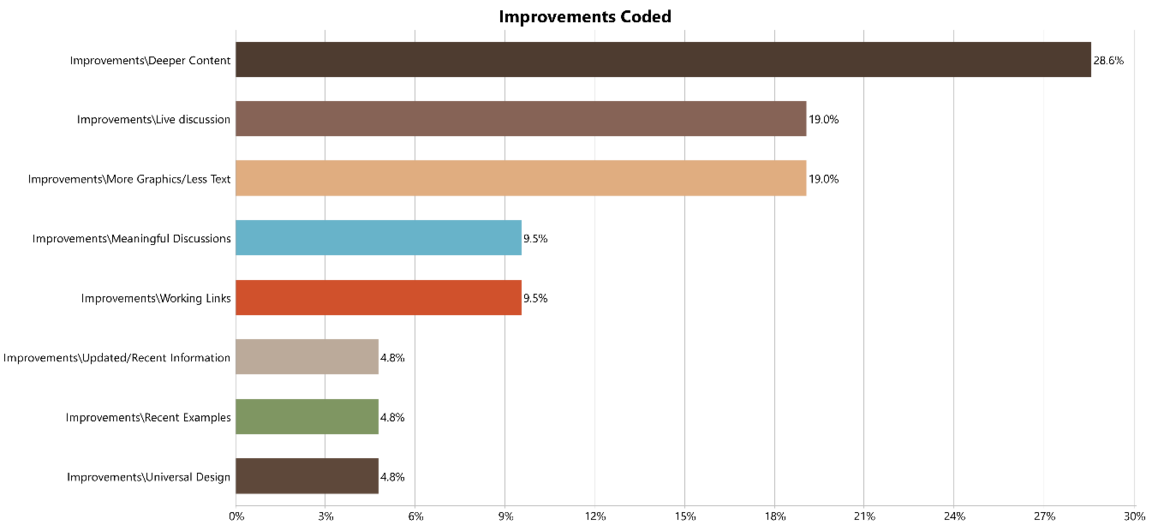
With respect to specific improvements, there was a desire for depth in content, as well as engagement – with instructors, with content, and with peers. There is also an ongoing request to make sure the course contains relevant and recent literature and examples – something always on the agenda of the course instructors with each round of course improvement and preparation for next launch.
Remember, full data analyses/reports available on our open course data page. All of this information is useful as direction, guidance, and direct feedback for course instructors on what is working well, what could be improved, and what participants are looking for with respect to experience in the course. While that’s standard for us, they’ll be considerable refresh given we’ll have the new content and approach from Greg and Megan, as well as thought partners in AEFIS to better provide and support participant learning and exploring of all things assessment.
Our next course is going to run from February 7, 2022 – April 3, 2022. We will update our general course website when registration is available. If you want to be sure you’re the first to know when the course is available to sign up, you can provide your contact information here to get an email when registration is open.
--
Blog written by Joe Levy, Open Course Manager.
Data analysis conducted by Joe Levy, with qualitative analysis support and coding from Vince Nix and Muzhen Zhang.